
Dynu's System Monitoring & DNS Failover service helps you monitor critical services
from multiple geographic locations and automatically respond when downtime is detected.
You can log into the control panel to add and manage your monitors.
A Keyword monitor works like an HTTP(S) monitor, but it also inspects the page content for a specific string. It is useful when a 200-level response code alone is not enough to confirm that your service is working correctly — for example, when an error page is returned with a successful status code, or when you want to verify that a specific piece of content is present on the page. If the keyword condition fails from two or more geographic monitoring locations, you will be notified and any configured failover actions will be triggered.
To add a Keyword monitor in the control panel, you may follow these 3 steps.
 Step 2
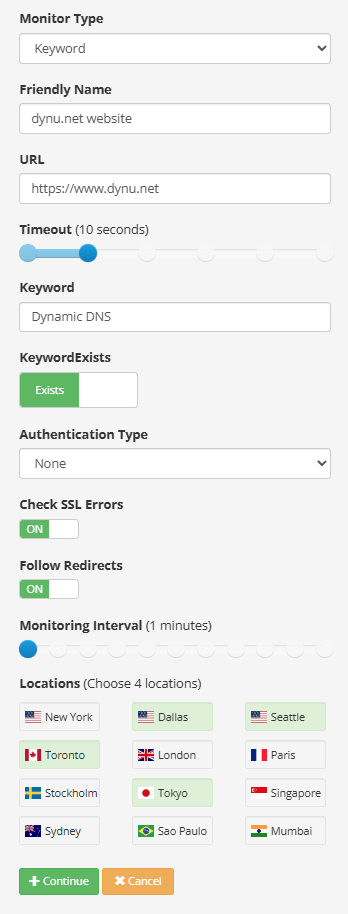
Configure your Keyword monitor using the following fields.
Monitor Type Choose "Keyword".
Friendly Name A descriptive label for the host and service being monitored. This name will appear in any notification emails sent to you. For example, [dynu.net](http://dynu.net) website .
URL The full URL whose page content will be inspected, including the protocol. For example, https://www.dynu.net .
Timeout The maximum time (in seconds) the monitor will wait for a response before treating the request as failed. You may select any value using the slider. For example, 10 seconds.
Keyword The expected return string. The keyword is case sensitive. For example, Dynamic DNS .
KeywordExists Determines how the keyword is evaluated against the returned page content.
Follow Redirects When set to ON, the monitor will follow HTTP 3xx redirects to the final destination URL and evaluate the response there. When set to OFF, the monitor checks only the response from the URL you provided.
Monitoring Interval How often the keyword check is performed. You may choose any value between 1 minute and 1 day using the slider. For example, 1 minute .
Locations Choose 4 geographic monitoring locations from the available list (e.g., New York, Dallas, Seattle, Toronto, London, Paris, Stockholm, Tokyo, Singapore, Sydney, Sao Paulo, Mumbai). Your service is checked simultaneously from all selected locations, and downtime must be confirmed from two or more locations before an alert is triggered — eliminating false alarms from single-point network issues.
Step 3
Click Continue to save the monitor. You can then proceed to set up notification contacts and failover actions for this monitor.
What is a Keyword monitor?
A Keyword monitor works like an HTTP(S) monitor, but it also inspects the page content for a specific string. It is useful when a 200-level response code alone is not enough to confirm that your service is working correctly — for example, when an error page is returned with a successful status code, or when you want to verify that a specific piece of content is present on the page. If the keyword condition fails from two or more geographic monitoring locations, you will be notified and any configured failover actions will be triggered.
How to add a Keyword monitor?
To add a Keyword monitor in the control panel, you may follow these 3 steps.
Configure your Keyword monitor using the following fields.
Monitor Type Choose "Keyword".
Friendly Name A descriptive label for the host and service being monitored. This name will appear in any notification emails sent to you. For example, [dynu.net](http://dynu.net) website .
URL The full URL whose page content will be inspected, including the protocol. For example, https://www.dynu.net .
Timeout The maximum time (in seconds) the monitor will wait for a response before treating the request as failed. You may select any value using the slider. For example, 10 seconds.
Keyword The expected return string. The keyword is case sensitive. For example, Dynamic DNS .
KeywordExists Determines how the keyword is evaluated against the returned page content.
- Exists: The criterion is met (no downtime detected) if the keyword is found in the returned text. If the keyword is not found, the monitor is flagged as DOWN. For example, "Dynamic DNS" appears on the Dynu home page, so choose Exists — the monitor will only go DOWN if the phrase disappears from the page.
- Not Exists: The criterion is met if the keyword is not found in the returned text. If the keyword does appear, the monitor is flagged as DOWN. This is useful for catching error pages — for example, configuring the monitor to go DOWN whenever the word Error appears on the page.
- None: Use this option if your server does not require authentication. No additional fields are needed.
- Bearer: Use this option if your server requires a bearer token (e.g., an API key or OAuth 2.0 access token). When selected, an additional Token field will appear — enter the bearer token value, which will be sent in the Authorization header of each request.
- HTTP Basic: Use this option if your server uses HTTP Basic authentication. When selected, additional Username and Password fields will appear — enter the credentials that will be supplied to your server with each request.
- Digest: Use this option if your server uses HTTP Digest authentication. When selected, additional Username and Password fields will appear — enter the credentials that will be used to compute the digest response sent to your server.
Follow Redirects When set to ON, the monitor will follow HTTP 3xx redirects to the final destination URL and evaluate the response there. When set to OFF, the monitor checks only the response from the URL you provided.
Monitoring Interval How often the keyword check is performed. You may choose any value between 1 minute and 1 day using the slider. For example, 1 minute .
Locations Choose 4 geographic monitoring locations from the available list (e.g., New York, Dallas, Seattle, Toronto, London, Paris, Stockholm, Tokyo, Singapore, Sydney, Sao Paulo, Mumbai). Your service is checked simultaneously from all selected locations, and downtime must be confirmed from two or more locations before an alert is triggered — eliminating false alarms from single-point network issues.
Click Continue to save the monitor. You can then proceed to set up notification contacts and failover actions for this monitor.