
Dynu's System Monitoring & DNS Failover service helps you monitor critical services
from multiple geographic locations and automatically respond when downtime is detected.
You can log into the control panel to add and manage your monitors.
An HTTP(S) monitor checks whether your web or application server is responding correctly to HTTP or HTTPS requests. Our monitoring servers send requests to the URL you specify at regular intervals and confirm that a successful 200-level response code is returned. If the server fails to respond — or returns an error code — from two or more geographic monitoring locations, you will be notified and any configured failover actions will be triggered.
To add an HTTP(S) monitor in the control panel, you may follow these 3 steps.
 Step 2
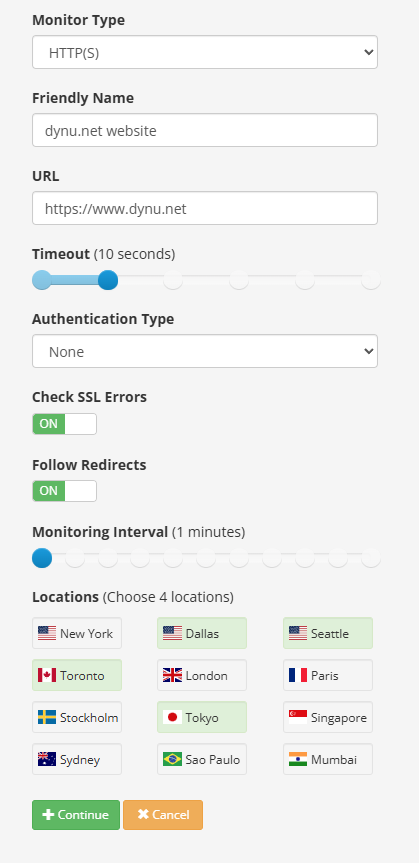
Configure your HTTP(S) monitor using the following fields.
Monitor Type Choose "HTTP(S)".
Friendly Name A descriptive label for the host and service being monitored. This name will appear in any notification emails sent to you. For example, dynu.net website .
URL The full URL that needs to be checked, including the protocol. For example, https://www.dynu.net .
Timeout The maximum time (in seconds) the monitor will wait for a response before treating the request as failed. You may select any value using the slider. For example, 10 seconds .
Authentication Type The authentication method required by your server. Available options are None, Bearer, HTTP Basic, and Digest. Depending on the option you choose, additional fields will be prompted as described below.
Follow Redirects When set to ON, the monitor will follow HTTP 3xx redirects to the final destination URL and evaluate the response there. When set to OFF, the monitor checks only the response from the URL you provided.
Monitoring Interval How often the HTTP(S) check is performed. You may choose any value between 1 minute and 1 day using the slider. For example, 1 minute .
Locations Choose 4 geographic monitoring locations from the available list (e.g., New York, Dallas, Seattle, Toronto, London, Paris, Stockholm, Tokyo, Singapore, Sydney, Sao Paulo, Mumbai). Your service is checked simultaneously from all selected locations, and downtime must be confirmed from two or more locations before an alert is triggered — eliminating false alarms from single-point network issues.
Step 3
Click Continue to save the monitor. You can then proceed to set up notification contacts and failover actions for this monitor.
What is an HTTP(S) monitor?
An HTTP(S) monitor checks whether your web or application server is responding correctly to HTTP or HTTPS requests. Our monitoring servers send requests to the URL you specify at regular intervals and confirm that a successful 200-level response code is returned. If the server fails to respond — or returns an error code — from two or more geographic monitoring locations, you will be notified and any configured failover actions will be triggered.
How to add an HTTP(S) monitor?
To add an HTTP(S) monitor in the control panel, you may follow these 3 steps.
Configure your HTTP(S) monitor using the following fields.
Monitor Type Choose "HTTP(S)".
Friendly Name A descriptive label for the host and service being monitored. This name will appear in any notification emails sent to you. For example, dynu.net website .
URL The full URL that needs to be checked, including the protocol. For example, https://www.dynu.net .
Timeout The maximum time (in seconds) the monitor will wait for a response before treating the request as failed. You may select any value using the slider. For example, 10 seconds .
Authentication Type The authentication method required by your server. Available options are None, Bearer, HTTP Basic, and Digest. Depending on the option you choose, additional fields will be prompted as described below.
- None: Use this option if your server does not require authentication. No additional fields are needed.
- Bearer: Use this option if your server requires a bearer token (e.g., an API key or OAuth 2.0 access token). When selected, an additional Token field will appear — enter the bearer token value, which will be sent in the Authorization header of each request.
- HTTP Basic: Use this option if your server uses HTTP Basic authentication. When selected, additional Username and Password fields will appear — enter the credentials that will be supplied to your server with each request.
- Digest: Use this option if your server uses HTTP Digest authentication. When selected, additional Username and Password fields will appear — enter the credentials that will be used to compute the digest response sent to your server.
Follow Redirects When set to ON, the monitor will follow HTTP 3xx redirects to the final destination URL and evaluate the response there. When set to OFF, the monitor checks only the response from the URL you provided.
Monitoring Interval How often the HTTP(S) check is performed. You may choose any value between 1 minute and 1 day using the slider. For example, 1 minute .
Locations Choose 4 geographic monitoring locations from the available list (e.g., New York, Dallas, Seattle, Toronto, London, Paris, Stockholm, Tokyo, Singapore, Sydney, Sao Paulo, Mumbai). Your service is checked simultaneously from all selected locations, and downtime must be confirmed from two or more locations before an alert is triggered — eliminating false alarms from single-point network issues.
Click Continue to save the monitor. You can then proceed to set up notification contacts and failover actions for this monitor.